
Sydney Water Planning Partner, Australia
Aurecon and Arup, in partnership with Sydney Water, are providing water management consultation with an increasing focus on delivering services.


Change your location to view content tailored for you.
Sydney Water, as Australia’s largest water utility, provides drinking water, wastewater, recycled water, and some stormwater services to more than 5 million people across Greater Sydney, Illawarra and the Blue Mountains.
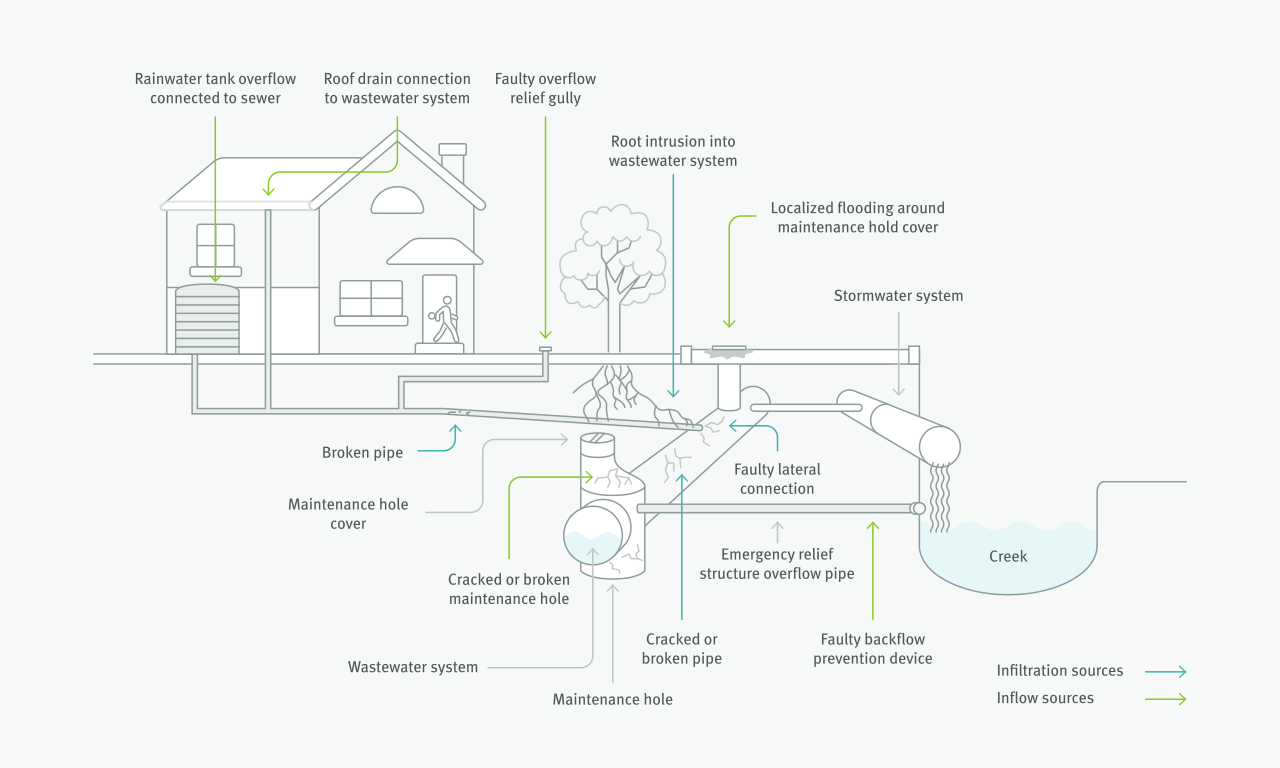
Similar to many water authorities in Australia, Sydney Water faced stormwater entering the wastewater system. These wet weather flows add to the total volumes passing through sewer pipes and then discharging into waterways. Wet weather overflows pollute the environment in several ways:
As part of the long-term partnership with Sydney Water, Aurecon applied digital engineering tools to identify how and where wet weather flows were entering the wastewater system. The Wet Weather Overflow Abatement Program inspected emergency relief structures – used to prevent sewer overflows through maintenance holes – and devised a digital platform to geographically plot the performance, condition and location of each structure.
Collating this information digitally enabled Sydney Water to prioritise capital improvement works according to the sites and areas that were contributing to the wet weather overflows.
The capital works investment identified from the digital platform has reduced stormwater spill frequency by up to 50 per cent.


Digital asset management is important for organisations to monitor and track asset data in a systemised way. To develop the digital platform for the Wet Weather Overflow Abatement Program, Aurecon fully integrated data from six different Sydney Water systems into one common data environment.
This was a complex data project:
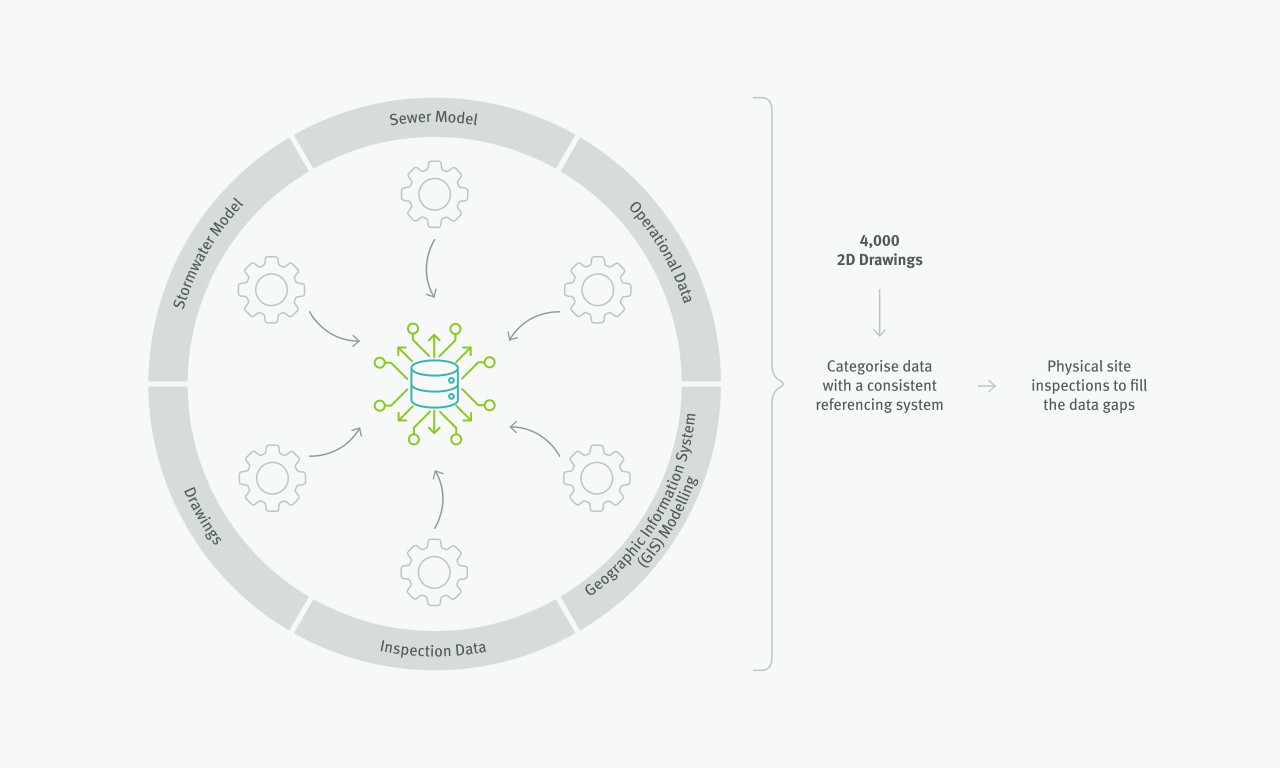
Due to the age of the emergency relief structures, and the disparate data on each asset, physical inspections of some assets was required to fill gaps in data. With field officers at the ready, a programme was devised to undertake physical asset inspections and collect asset performance, location and condition data. This wasn’t an easy task. Underground assets were hard to reach and the volume of data to extract was onerous.
Aurecon’s innovative use of statistical analysis and digital hydraulic modelling guided the cyclical approach of collecting, analysing and consolidating data.
Aurecon and Sydney Water created a digital record capture programme for each field officer to collect the large volume of data required from each individual asset. Using a tablet, field officers at each site captured and uploaded photos, videos, digital scans, geographical positioning and modelling data into the digital programme.
The site data was integrated with the digital asset management application in real-time and the output was a visual dashboard of asset position, performance, type and condition.
In terms of mapping data from the historical databases and the physical inspection process, one of the most important factors was to have a visual picture of the asset locations, especially the buried assets. The digital platform was designed to present volumes of data as visual dashboards for Sydney Water and its stakeholders.
The result was a user-friendly digital asset management dashboard that provides Sydney Water with real-time information on each emergency relief structure within the programme’s geographical area. The dashboard is used to track changes to the structure inventory, track asset failures and provide a detailed insight into the condition of assets.
In 2012, Sydney Water estimated that more than $5 billion was required to construct additional transfer pipework, treatment and storage facilities to handle the capacity of wet weather overflows. The Wet Weather Overflow Improvement Programme changed all that. Through the collection, consolidation and statistical analysis of the data on each emergency relief structure asset, the programme team discovered the true sources of wet weather flows.
This approach provided Sydney Water with detailed insights on where exactly overflow issues were originating from to manage a more refined capital works programme to upgrade assets and reduce wet weather overflows. The team started with terabytes of data and designed a dashboard to interrogate it. This presented the data in a visually compelling way that was easy to understand and allowed for more manageable planning and repair of emergency relief structures.
The resulting programme of works to prioritise, repair and replace assets has mitigated the initial billion-dollar expenditure by up to 80 per cent.
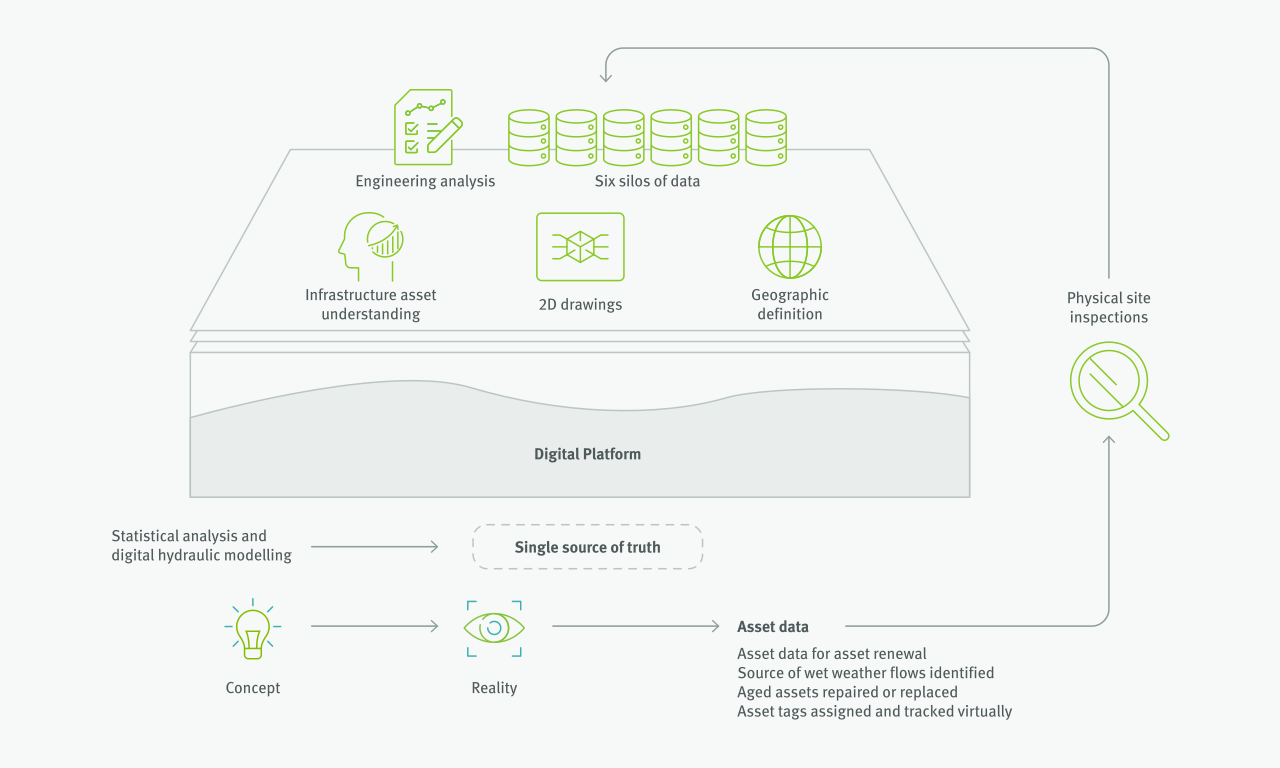
The customisable nature of digital engineering used on the Wet Weather Overflow Programme allowed the creation of a bespoke digital asset management platform that interrogated vast amounts of stormwater, wastewater and property data to determine where wet weather overflows were originating from. This data analysis had never previously been available to Sydney Water.
Armed with geo-linked digital asset data, the capital works investment identified from the digital platform has reduced stormwater spill frequency by up to 50 per cent and the overall spilt volume by up to 85 per cent. What began as a pilot programme in a single area of Sydney Water’s catchment was expanded to cover one quarter of the entire wastewater asset network.
Aurecon and Arup, in partnership with Sydney Water, are providing water management consultation with an increasing focus on delivering services.
Aurecon is transforming Sydney Harbour, replacing dredging with TBM tunnel engineering to deliver a faster, safer and more sustainable second harbour crossing.
Aurecon's active transport design expertise supports TfNSW to create a seamless, unobtrusive, step-free ramp and cycleway across Sydney Harbour Bridge.