Brisbane 2032: Creating lasting impact through transformative infrastructure
Aurecon shares insights on how the 2032 Brisbane Games can deliver legacy infrastructure and lasting economic, environmental and community value.


Change your location to view content tailored for you.
Visualising a design and a broad array of implications is the key to unlocking efficiency and productivity in the construction industry. When managing a project, neither owners, developers, architects, engineers nor contractors want to face excavation shocks or deal with structural blunders along the way. These issues in the works can lead to scheduling delays, escalate costs and increase commercial risk.
Digital visualisation tools can bring to life designs in a visually rich and compelling manner that not only mitigate uncertainty but also increase efficiency and productivity.
Technological disruption has reshaped the construction industry in Asia. As that disruption has accelerated, particularly in the past five years, digital visualisation tools are playing a growing role in altering the life cycle of building and infrastructure projects. A case in point is how Aurecon leveraged these tools as digital advisor for design and construction of the True Digital Park Phase II with Magnolia Quality Development Corporation Limited in Bangkok, Thailand.
The digital visualisation toolkit, comprising various digital technologies, has expanded from the 2D computer-aided drawings of the 1970s to the modern plethora of high-tech aids. Today, Building Information Modelling (BIM) tools, drone technology, virtual reality (VR), augmented reality (AR), mixed reality (MR), 4D construction sequencing and information tracking tools are just some of the big-box technologies that the architecture, engineering and construction (AEC) sector tap to raise its technological game.
How can digital visualisation tools be used at different stages of a project from master planning to construction, and how can these tools be leveraged to add value to every project?
An indispensable tool, VR provides an accurate depiction of the design stages of a project. In an industry that relies on hand mark-ups and sketching to capture complex onsite discrepancies such as pipe obstructions or clashes, VR offers immersive to-scale walkthroughs of designs in a virtual space, increasing interdisciplinary coordination like never before.
Paired with 3D models, VR allows stakeholders to see multiple components coming together, highlighting potential issues in the operation and function of a building that may be otherwise hidden in a 2D drawing or even a 3D model.


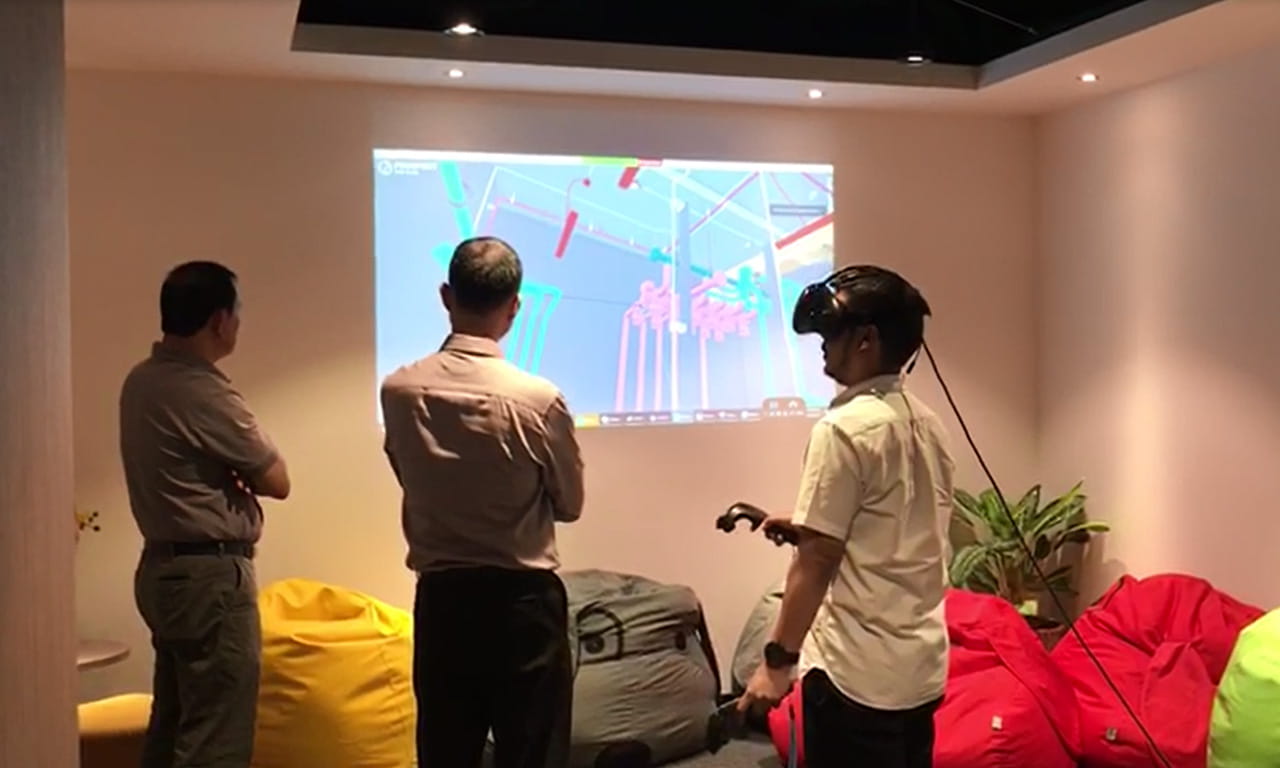
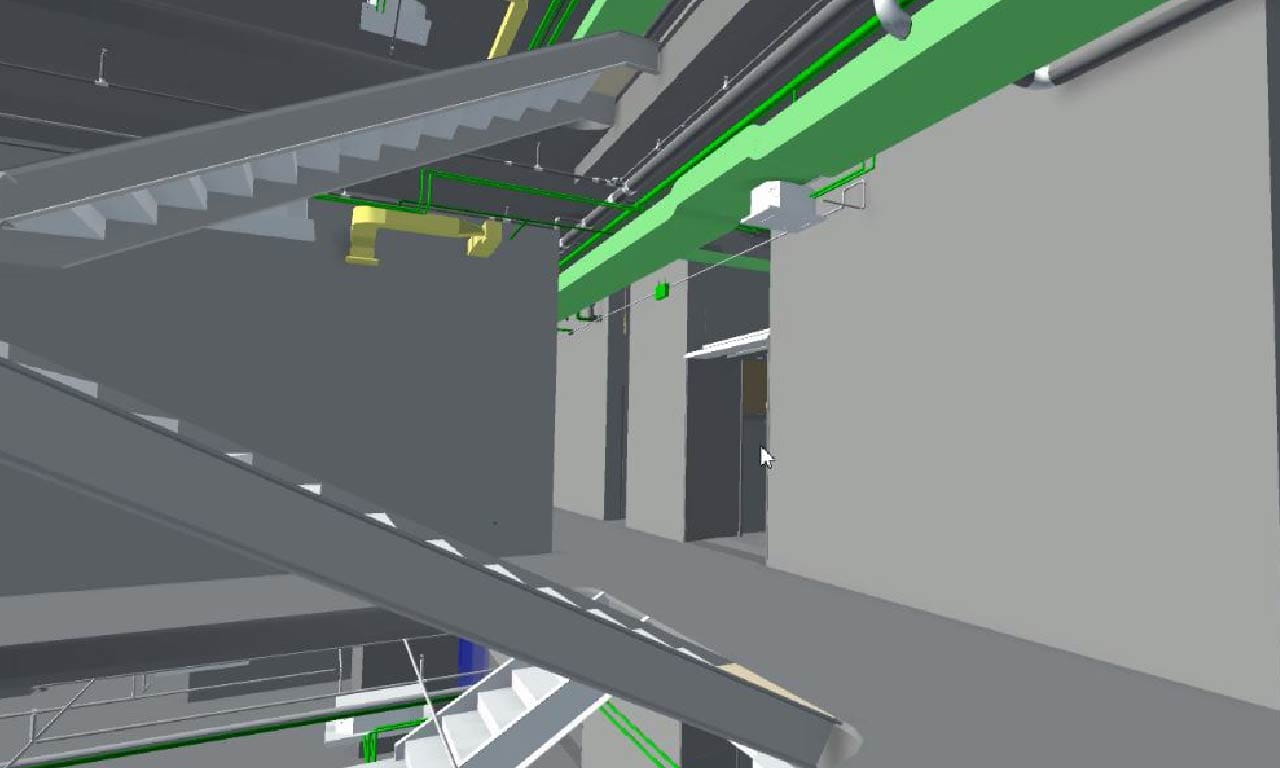
One VR tool adopted for design and construction is siteLab, Aurecon’s in-house enterprise design visualisation software. There are other commercial off-the-shelf VR tools such as Iris VR which allows up to 10 meta (persons) to join the same meeting room for a walkthrough and mark up, and Revizto, a cloud-based visual collaboration software which provides an immersive VR experience for users.
VR sets a holistic conversation platform: “There is an issue. These are the solution options. What is the decision?” Such conversations are especially vital in complex construction builds or projects within an existing infrastructure. Instead of work grinding to a halt, modellers can gather feedback, make revisions and test the new solutions quickly. Indeed, VR has elements that ensure construction adheres to the design intent and decreasing variations.
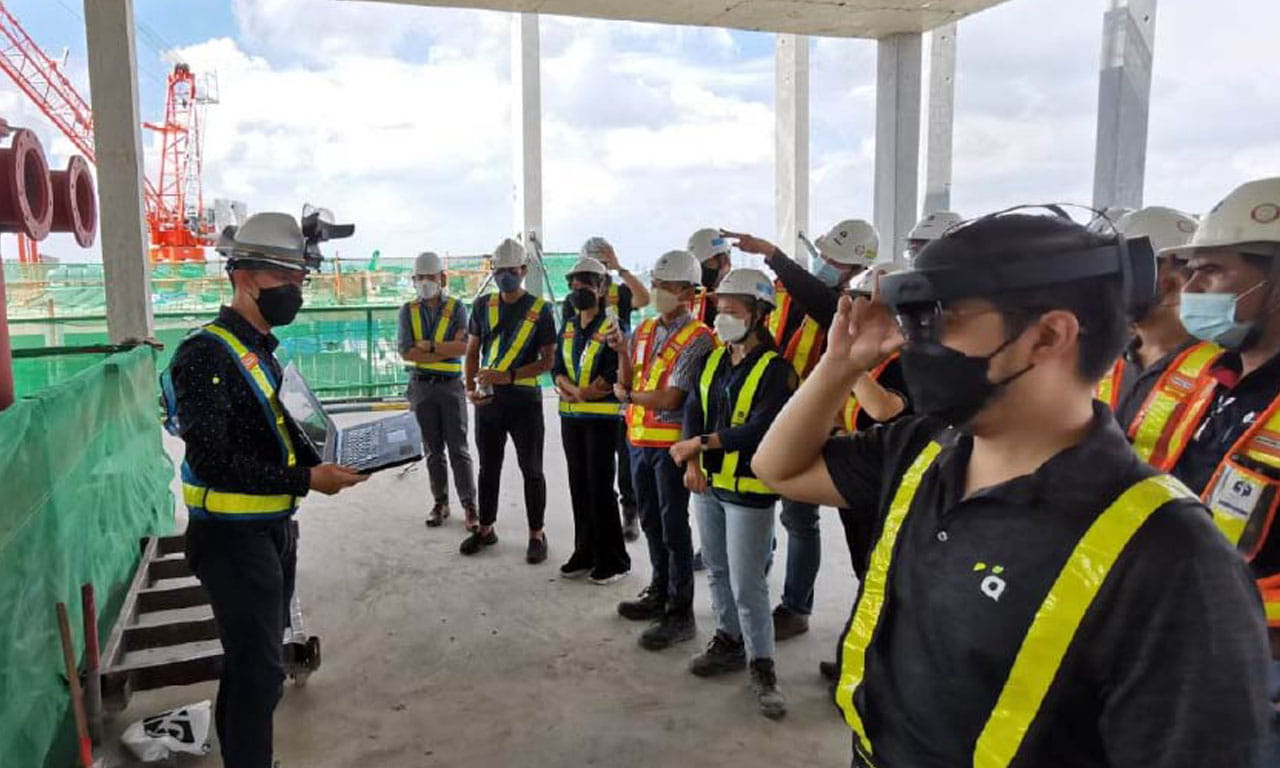
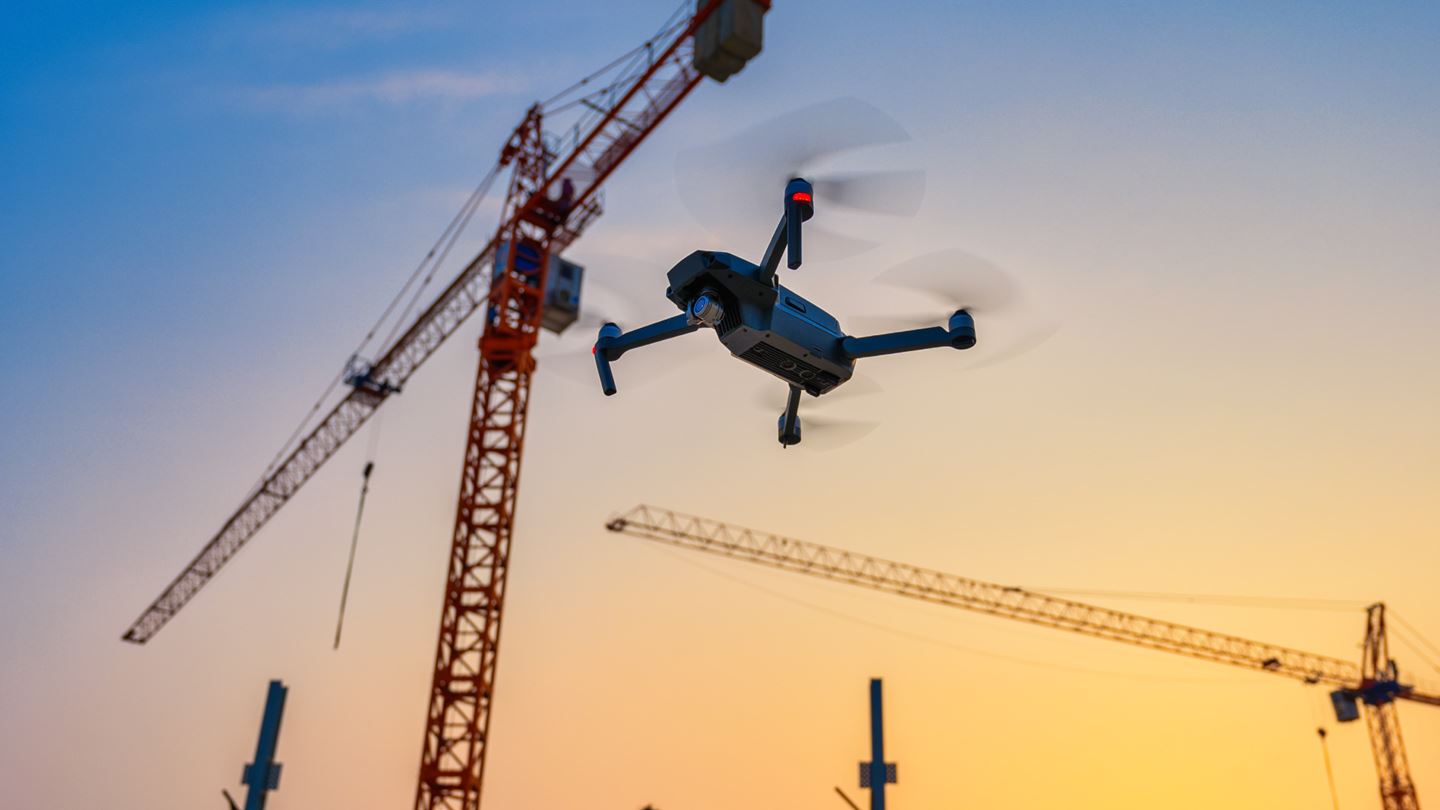
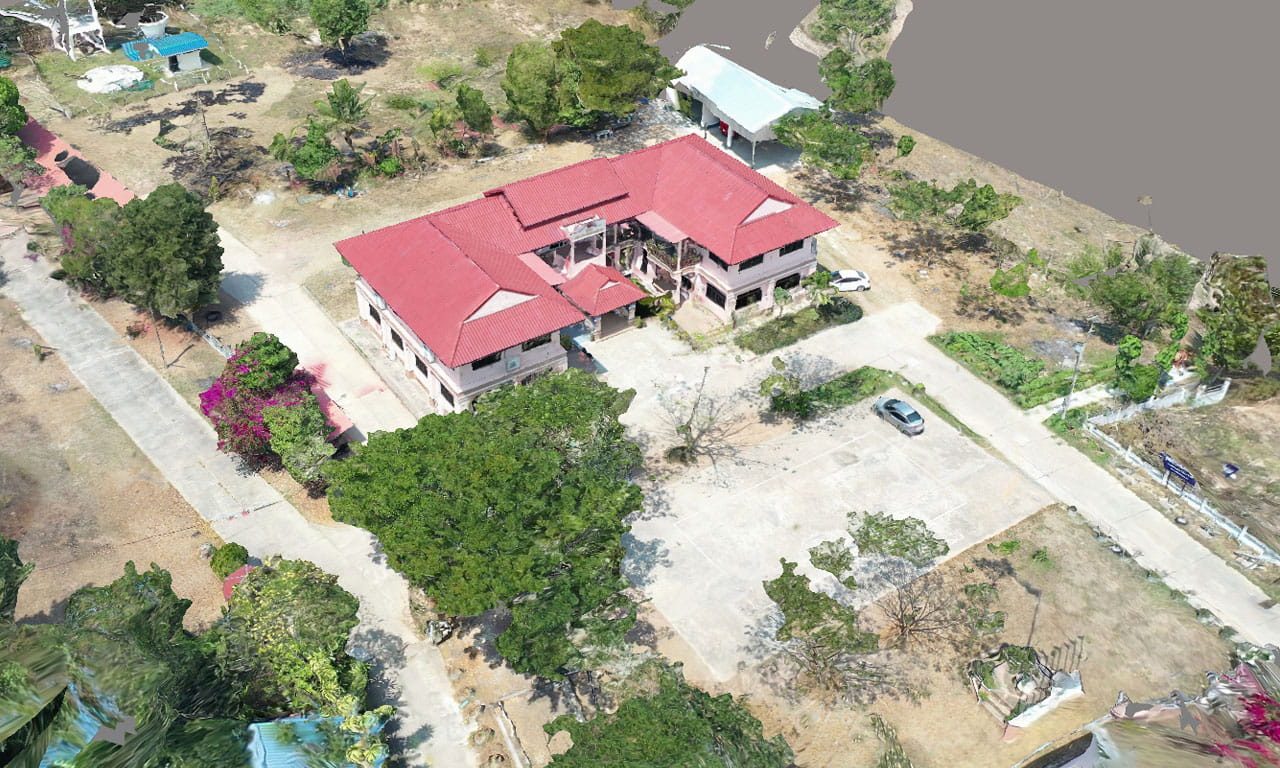
Drones or unmanned aerial vehicles (UAVs) scour project sites, take hundreds of aerial images from multiple angles, tag them to geological coordinates and give an accurate picture of site conditions – even in inaccessible areas such as steep slopes.
By pairing photogrammetry with laser scanning and Geographic Information Systems (GIS), images can be combined to generate 3D visualisations, which can then be used to extract precise information above and below ground, such as distances, surfaces and volumetric measurements.
Such 3D mapping presents to planners a good understanding of the land, indicating existing drain to terrain elevations. This is especially useful for major infrastructure projects involving slopes, bridges, tunnels and highways, where the use of drones and UAVs can provide key insights on how to manage challenging or unknown terrain, as with this highway project in Thailand:
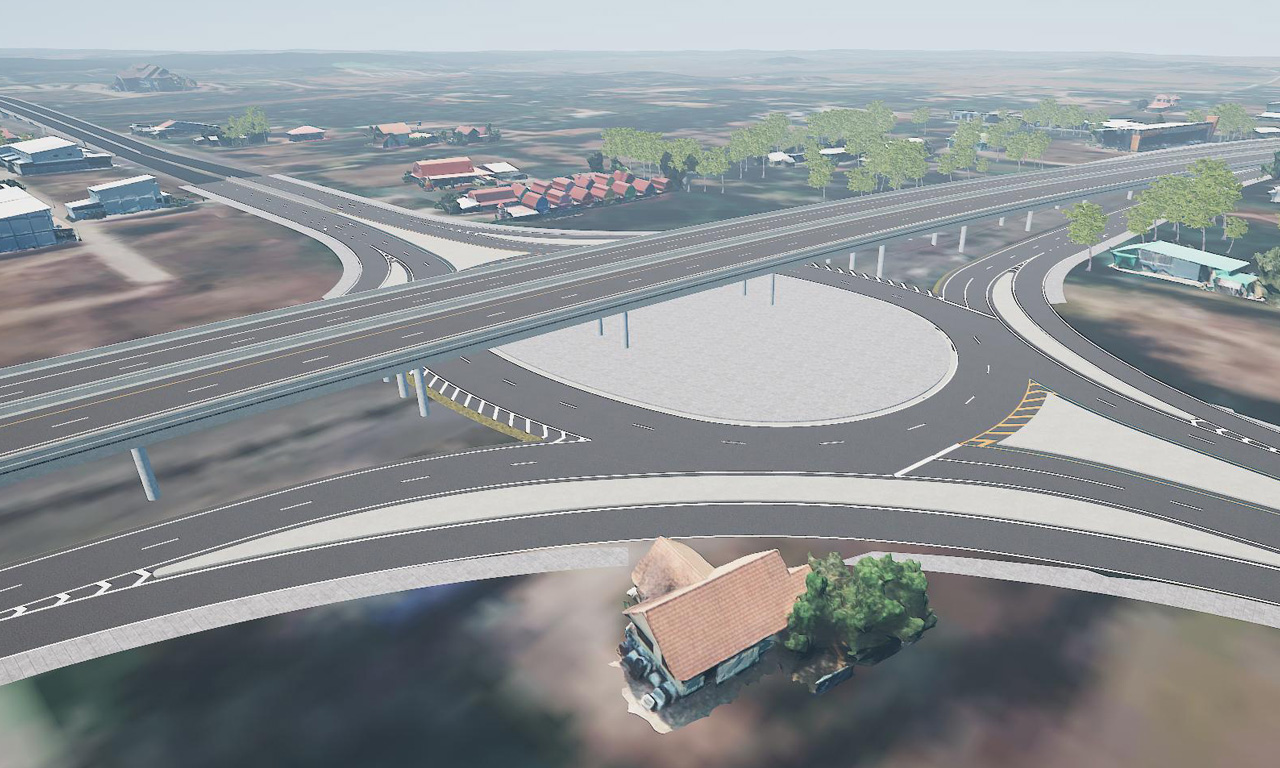
Through the use of drones, engineers can survey and visualise the impact of this new highway project early on. The drones can capture the existing condition over 13 kilometres and integrate the footage with the new road design in siteLab to provide an effective VR experience for the locals and stakeholders. By doing so, engineers can get direct feedback and engage them better.
The outcome was greater receptiveness from the locals, lesser time spent on planning and survey costs, and increased efficiency and accuracy.
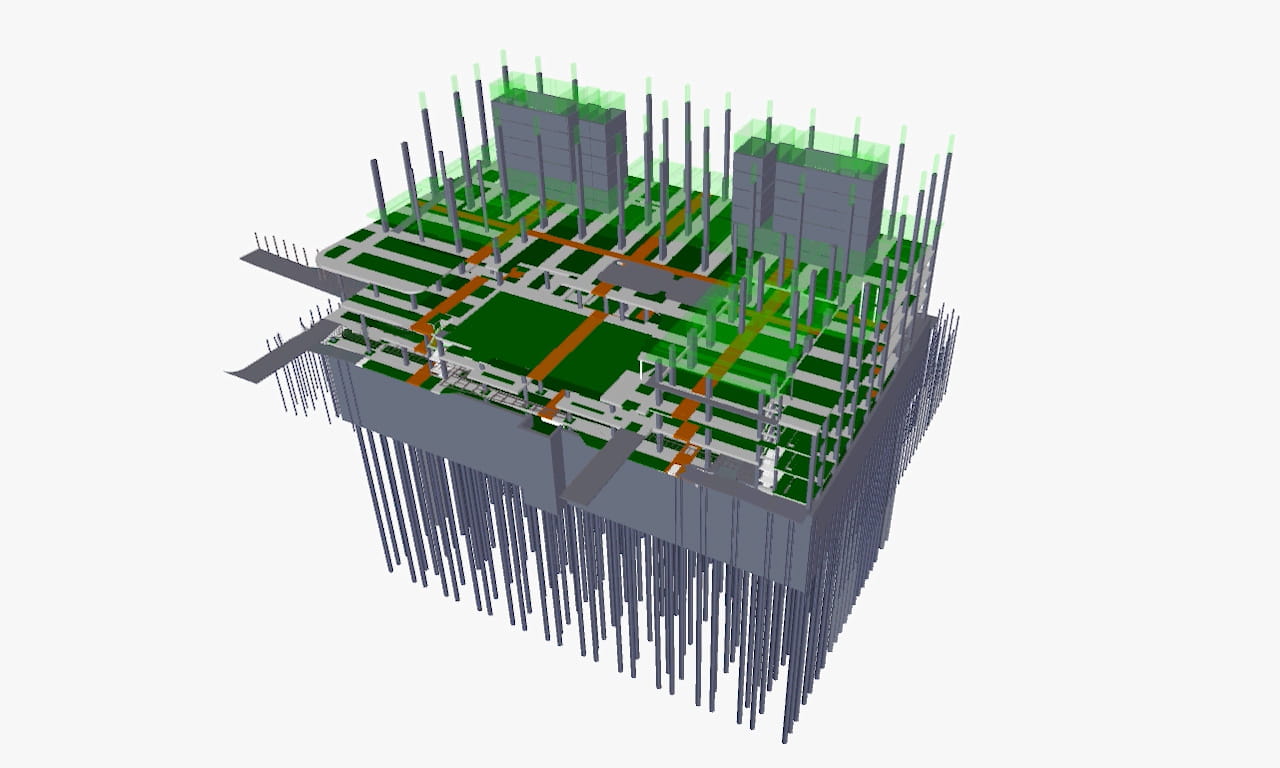
With 3D visuals synchronised against a scheduling timeline, construction sequencing brings together the entire process of on-site construction in a simulated ballet of moving parts. As a collaborative tool enabled through BIM, the main functionality of 4D construction sequencing and 5D procurement quantity take-offs is to combine 3D models, build data, and schedule resources and materials to create an intelligent visual construction timeline.
In many ways, BIM and its spectrum of collaborative tools such as 4D model construction sequences and 5D cost information form an intelligent control system that can be used to oversee every stage of the construction process. Such a central delivery programme allows all stakeholders to visualise what is happening, where and when.
All parties have a bird’s eye view of construction timelines and sequences, ensuring that critical activities do not clash. Minimising disruptions, logistical risks, and site management issues through 4D and 5D BIM is particularly vital where more hands are on deck such as in builds with multiple towers or precincts.
Additionally, and importantly, clash-detection scans quickly flag material conflicts such as pipework against beams. 5D’s cost planning feature also removes the ambiguity and inconsistencies in project cost estimations. Spotting these issues – and addressing them pre-construction – is far superior and more cost effective than fixing them on site.
A myriad of issues can crop up during construction. Different stakeholders, whether be it the building owner, developer, project manager or contractor, may have different ways of flagging issues and marking them as resolved. Construction project visualisation puts workflows, teams and data on the same page – on a dashboard – in real time.
Drawing from varied data sources (financial to scheduling), and business intelligence and management software, digital visualisation dashboards power up important metrics on a single screen. The one-view display can track work scheduled, work performed, and costs expended – even schedule and cost variances.
These live dashboards can also identify major or minor issues, where they lie (in a zone or in a tower, by room or by floor), and whose discipline it is (structural, civil or electrical). Once the problem is flagged, an alert is triggered to the right party to rectify it prior to construction.
Certainly, digital visualisation adoption varies from country to country within Asia. The pace of adoption depends on national agendas, regulatory readiness as well as public and private resources. However, several factors already form the impetus of digital visualisation adoption in the region.
Firstly, AEC firms are gradually adopting digital visualisation to improve the overall design and construction quality in the Built Environment. Secondly, a COVID-19 world hastens digital collaboration, with virtual walkthroughs allowing planning flexibility despite the rigidities of pandemic lockdowns. Finally, digital visualisation tools themselves are now at a mature stage. Hence, adoption becomes a matter of imperatives – keeping up with a global push for digital transformations and future-proofing manpower to meet tomorrow’s skill set demands.
Professional councils in architecture and engineering, including BIM Association, BIM Alliance, BuildingSMART in many Asian countries are pushing a framework. With an established framework, design engineering companies can ensure their digital visualisation services adhere to clear guidelines and ride on the industry-wide initiatives and champion the benefits of digital visualisation as a tool that can be used throughout a project’s life cycle.
However, digital education, research, and strategic implementation are the key for future maturity of Asia’s market. For digital adoption to soar in the region, policy makers must look beyond well-laid out macro frameworks to catalyse actionable plans, flex official authority and tap organisational expertise to do so. Additionally, national agencies, industry associations and private companies must develop national standards as a platform for improving consistency in the exchange of information.
As exemplified by the True Digital Park Phase II project, digital visualisation tools offer unparalleled benefits to managing risks and improving design outcomes throughout the design engineering life cycle – from planning, to building, and to maintenance. Not least because these tools enable testing in a digital environment prior to making investments in construction, as well as reduce operational errors and major rectifications during a build.
Using UAVs can generate the photogrammetric models for analysing the contextual condition and expedite the surveying process. VR and AR bring about greater design quality checks and construction preparation, leading to better utilisation of space, saving time and costs, and increasing labour efficiency and competencies.
Digital visualisation dashboards are an indispensable tool for information management. They give a top-line view of granular diagnostics of everything from the works’ status to spending. Such a command-and-control picture – always available in the cloud – allows project managers to quickly surmise a project’s progress, assess areas that require quick resolutions and make macro decisions.
In a world of information overloads, high quality digital visualisation can bring real-life changes that cannot be overlooked. At this juncture, a nod to American mathematician John Tukey is appropriate. Regarded as the pioneer of big data and visualisation, Tukey holds sway in these words: “The greatest value of a picture is when it forces us to notice what we never expected to see.”
Contributing author & reviewer: Trong Anantmongkol

Practice Leader, Digital – Thailand
Aurecon shares insights on how the 2032 Brisbane Games can deliver legacy infrastructure and lasting economic, environmental and community value.
How engineering and construction projects are evolving to champion biodiversity, through early planning, advanced technologies, and ecosystem stewardship.
AI solutions offer huge benefits for businesses, but knowing where to invest in AI matters. Aurecon's digital experts discuss where AI can make the most impact.